
January 2018 - Now
Work as researcher in,
Institute for Research in Fundamental Sciences (IPM)
predict the chance of consciousness recovery of comatose using functional
near-infrared spectroscopy (fNIRS)
fNIR Project
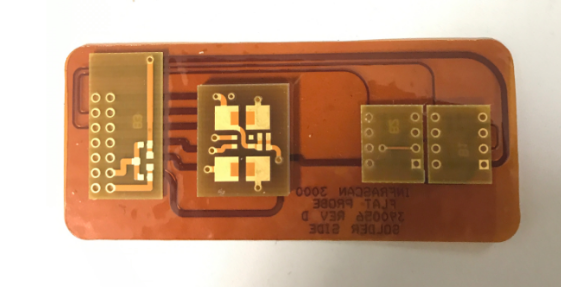
The fNIR imaging device, consisting of a micro-controller that programs a circuit that will emit 2-4 near-infrared electromagnetic waves in the range of 730-900 nm wavelength. Near-infrared detectors will receive the light that was not absorbed in the tissue. Having known the amount of the emitted photons and comparing it with the detected light that passed through the tissue, one could measure the characteristics of the exposed tissue. In the fNIR imaging systems, two wavelengths of 730 and 850 are used which are sensitive to deoxyhemoglobin and oxyhemoglobin respectively. With this measurement, we could evaluate the hemodynamic changes in the exposed area. The fNIR system is getting widely accepted for use in the conditions that evaluation of hemodynamics is important but for any reason, it is not feasible to use fMRI. For instance, in the outdoors, in the army, at the bedside of patients in ICU, fNIR imaging is approved by the clinicians and FDA.
In this project, we record hemodynamic changes using fNIRS during stimulus presentation (such as moderate noxious stimulus, olfactory stimulus, etc.) and baseline. Using functional principal component analysis, oxyhemoglobin (HbO2) and deoxyhemoglobin (Hb) curves are decomposed into several components based on variability across the subjects. Despite the continuous nature of the processes generating the data, analysis of fNIRS data has been mostly limited to discrete-time methods. Here, as an alternative we use a technique called functional data analysis (FDA). Dr. Pourrezaei's lab pioneered using FDA for the analysis of fNIRS data and is currently our collaborators in this project. In short, FDA converts discrete samples to continuous curves.
We investigated the feasibility and practical issues for manufacturing extra fNIR devices with increased signal to noise ratio decreased spatial engagement with a user-friendly interface. In included the following steps:
Hardware design and improvement
main shield design
lock-in amplifier circuit
The wireless device as a Bluetooth-enabled compact device
Flexible probes for subject comfort
Software Design and improvement
Arduino programming
PSOC programming
MATLAB GUI and App Designer as an interface
In this project, I work on the PSoC Programming and signal processing part. Also, I try to create an interface for different kind of filtering which we examine on recorded signals, for this goal, I use Matlab App Designer as an interface.
1. Hardware Design and Improvement


2. Software Design and Improvement
Arduino Programming Interface
Different micro-controllers that are easy to program and economically accessible, could be used in controlling the circuits. Among these, Arduino is well-known. The current fNIR imaging systems in the Lab are using Arduino. Therefore, one of the students started learning its programming and taught it to the other group members.


PSOC 5LP development kit
A new advancement in the field of micro-controllers is PSoC (Programming system on Chip). This is a family of micro-controller integrated circuits by Cypress Semiconductor. A PSoC integrated circuit is composed of a core, configurable analogue and digital blocks, and programmable routing and interconnect. The configurable blocks in a PSoC are the biggest difference from other micro-controllers. As a result, we are planning to use PSoC for the next generations of the fNIR imaging systems that we will manufacture. Dr Pourrezaei has provided us with a PSoC 5LP development kit and PSoC modules. I am focused on learning the PSoC programming and taught it to the rest of the group.
MATLAB GUI for fNIR Imaging
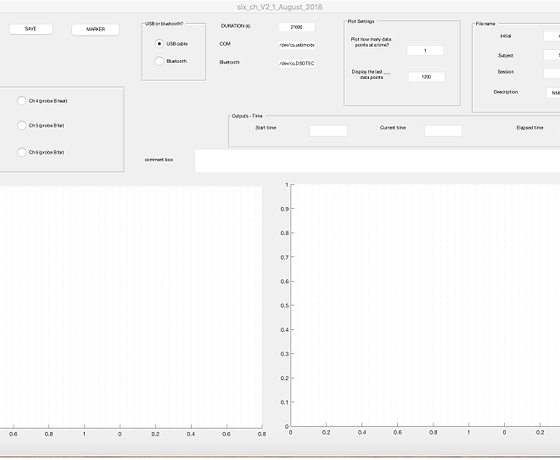
Matlab GUI (graphical user interface) is used as an interface for the user to monitor the hemodynamic changes online during the recording and choosing the appropriate parameters for the recording. In order to make a commercial device, we worked on learning to improve the GUI. In the future, we are supposed to work with LabView to make a more user-friendly interface.
MATLAB App Designer for signal processing
We use Matlab App Designer as an interface for the signal processing. I worked on the user friendly interface to examine different kind of filtering on recorded signal.

